"I don't always profile in Java.
But when I do,
I use Visual VM"
DEBUGGING AND PROFILING
One of the advantages of a virtual-machine runtime like Java is easy debugging and profiling.
When developping you want to know :
- how much time is spent by your game doing what and how many memory does it take : cpu and memory profiling.
- when something goes wrong, find who or what is fucking things up : debugging.
Sure Java IDEs can do step by step debugging and you can write logs at runtime and do hand-made performane checks, but you can get so much more informations with a proper profiler.
It happens there is a really great free profiler for Java : Visual VM
VISUAL VM - MONITOR
Visual VM has several information panels and profiling tools you can launch.
The panel I spend most of my time anxiously looking at is the Monitor panel
You can see CPU and Memory usage at a glance, and in particular how much of a sneaky bastard the Garbage Collector is. When you get an old lag in game, look there and its propably the GC doing its thing.
In practice:
 |
| I C U GC!! |
VISUAL VM - HEAPDUMP(*)
Visual VM can hump the deap mmmh head the bump aaaaah dump the head for you.
You can see everything that is in Java VM memory, how much memory individual objects take, how many instances of each classes there are etc...
 |
| Hey you! Dump your heap! Now! |
 |
| HALT! PAPIERS BITTE! |
Believe it or not, it happened to me zomg! When moving around the world in game, in the heapdump I spotted entities and chunks that should not be there anymore. They were not active, but still in memory and couldn't be GCed. By looking at references in Visual VM, I found out the culprit : my debug ray tracer always kept a reference to the last entity traced. So the entity and all referenced objects could not get GCed even when my camera was now a million chunks away. DOH.
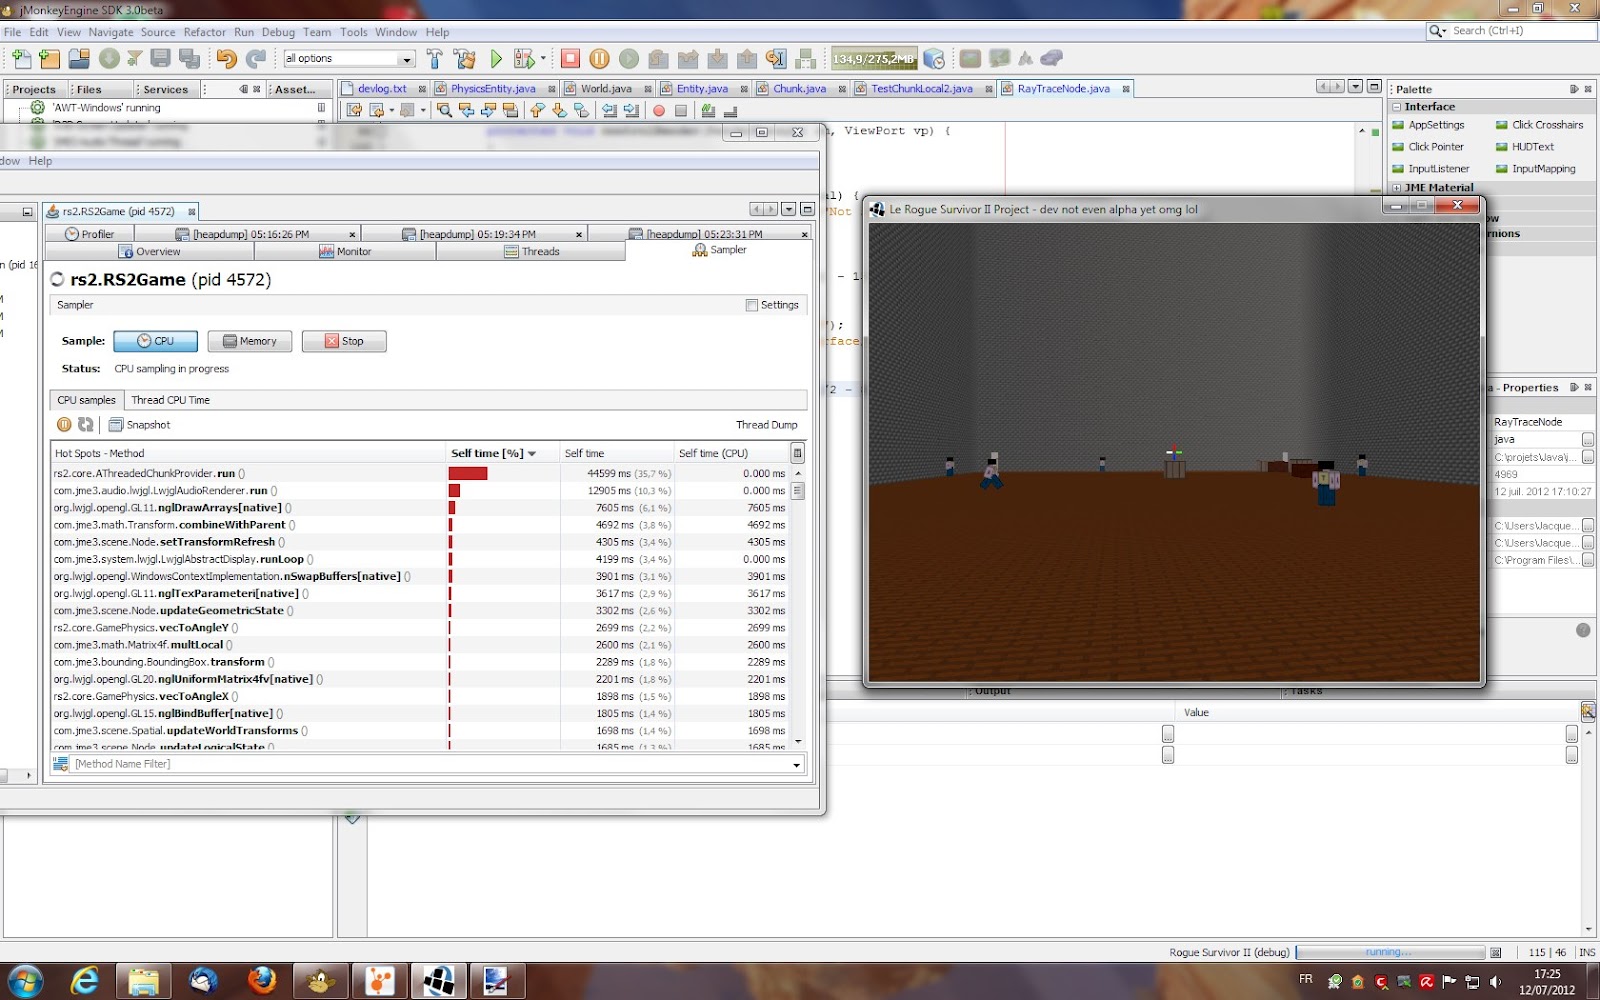
VISUAL VM - PROFILING
Visual VM can profile CPU and memory.
You have two kind of profiling :
- incurrate but lightweight and painless : sampler.
- proper profiling which of course kills your framerate : profiling.
Beware of using only sampling, it can be misleading.
 |
| Too lazy to profile... |
 |
| Pro profile. |
So, if you develop in Java and want a good and free profiler : GO GET IT!
* * *
"I don't always use source control,
But when I do,
I use SVN."
I keep a "devlog.txt" where I write daily what I do. I also do daily backups on my trusty USB key. It quickly gets messy, and while I know my code I can sometimes forget when and why I did what I did.
So in addition to that I now use proper source control with SVN.
 |
| "Oh... I did that..." |
End of post.
(*) I keep reading this as "Headbump" trolololo
No comments:
Post a Comment